Energy Shift
The Future of Uranium: A Story of Supply and Demand
The following content is sponsored by Standard Uranium.

The Future of Uranium: A Story of Supply and Demand
The uranium market is at a tipping point.
Since the Fukushima accident in 2011, uranium prices have been on a downtrend, forcing several miners to suspend or scale back operations. But nuclear’s growing role in the clean energy transition, in addition to a supply shortfall, could turn the tide for the uranium industry.
The above infographic from Standard Uranium outlines how uranium’s demand and supply fundamentals stack up, and how that balance could change the direction of the market in the future.
The Uranium Supply Chain
The supply of uranium primarily comes from mines around the world, in addition to secondary sources like commercial stockpiles and military stockpiles.
Although uranium is relatively abundant in the Earth’s crust, not all uranium deposits are economically recoverable. While some countries have uranium resources that can be mined profitably when prices are low, others do not.
For example, Kazakhstan hosts roughly 1.2 billion lbs of identified recoverable uranium resources extractable at less than $18 per lb, more than any other country. On the contrary, Australia hosts a larger resource of uranium but with a higher cost of extraction. This varying availability of resources affects how much uranium these countries produce.
| Country | 2019 production (lbs U) | % of Total |
|---|---|---|
| Kazakhstan 🇰🇿 | 50,282,973 | 42.1% |
| Canada 🇨🇦 | 15,308,881 | 12.8% |
| Australia 🇦🇺 | 14,579,152 | 12.2% |
| Namibia 🇳🇦 | 11,250,176 | 9.4% |
| Uzbekistan 🇺🇿 | 7,716,170 | 6.5% |
| Niger 🇳🇪 | 6,730,705 | 5.6% |
| Russia 🇷🇺 | 6,393,398 | 5.3% |
| China 🇨🇳 | 3,527,392 | 3.0% |
| Ukraine 🇺🇦 | 1,653,465 | 1.4% |
| India 🇮🇳 | 881,848 | 0.7% |
| South Africa 🇿🇦 | 762,799 | 0.6% |
| United States 🇺🇸 | 147,710 | 0.1% |
| Rest of the World 🌎 | 308,647 | 0.3% |
| Total | 119,543,315 | 100% |
It’s not surprising that Kazakhstan is the largest producer of uranium given its vast wealth of low-cost resources. In 2019, Kazakhstan produced more uranium than the second, third, and fourth-largest producers combined.
Canada produced around one-third of Kazakhstan’s production despite the suspension of the McArthur River Mine, the world’s largest uranium mine, in 2018. Australia was the world’s third-largest producer with just two operating uranium mines.
However, production figures do not tell the entire story, and it’s important to look at how the market price of uranium impacts supply.
How Uranium Prices Affect Supply
Low uranium prices have had a twofold effect on uranium supply over the last decade.
Firstly, miners have cut back on production due to the weakness in prices, reducing the primary supply of uranium. Here are some production cutbacks from major uranium mining companies:
| Year | Company | Production Cutback |
|---|---|---|
| 2016 | Cameco 🇨🇦 | Production at Rabbit Lake Mine suspended |
| 2017 | Kazatomprom 🇰🇿 | Output reduced by 10% |
| 2018 | Kazatomprom 🇰🇿 | Output reduced by 20% |
| 2018 | Paladin Energy 🇦🇺 | Production at Langer Heinrich Mine suspended |
| 2018 | Cameco 🇨🇦 | Production at McArthur River Mine suspended |
| 2019 | Kazatomprom 🇰🇿 | Output reduced by 20% |
Table excludes suspensions induced by COVID-19.
Sources: Cameco, WISE Uranium Project, Paladin Energy
In addition, low prices have also blocked new supplies from entering the market. Around 46% of the world’s identified uranium resources, 8 million tonnes, have an extraction cost higher than $59 per lb. However, uranium prices have hovered close to $30 per lb since 2011, making these resources uneconomic.
As a result, the supply of uranium has been tightening, and in 2020, mine production of uranium covered only 74% of global reactor requirements.
Going Nuclear: The Future of Uranium
The world is moving towards a cleaner energy future, and nuclear power could play a key role in this transition.
Nuclear power is not only carbon-free, it’s also one of the most reliable and safe sources of energy. Countries around the world are beginning to recognize these advantages, including Japan, where all 55 reactors were previously taken offline following the Fukushima accident.
With more than 54 reactors under construction and 100 reactors planned worldwide, the demand for uranium is set to grow. Unlocking new and existing supplies is critical to meeting this rising demand, and new uranium discoveries will be increasingly valuable in balancing the market.
Standard Uranium is working to discover uranium with five projects in the Athabasca Basin, Saskatchewan, Canada, home of the world’s highest-grade uranium deposits.
Energy Shift
The World’s Biggest Oil Producers in 2023
Just three countries accounted for 40% of global oil production last year.

The World’s Biggest Oil Producers in 2023
This was originally posted on our Voronoi app. Download the app for free on iOS or Android and discover incredible data-driven charts from a variety of trusted sources.
Despite efforts to decarbonize the global economy, oil still remains one of the world’s most important resources. It’s also produced by a fairly limited group of countries, which can be a source of economic and political leverage.
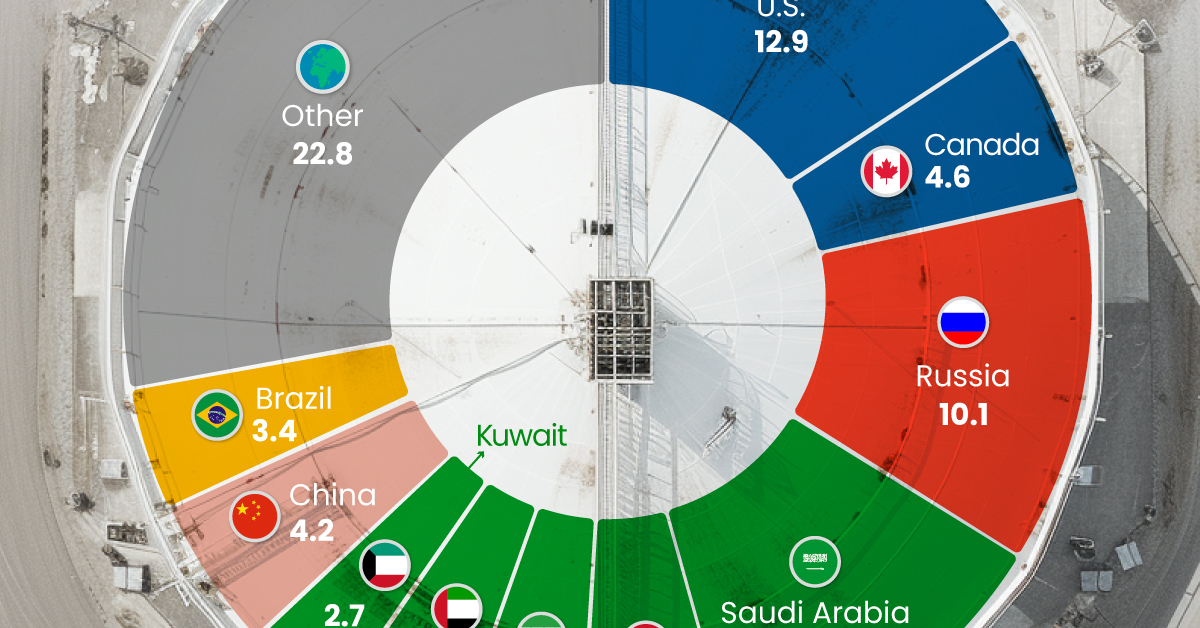
This graphic illustrates global crude oil production in 2023, measured in million barrels per day, sourced from the U.S. Energy Information Administration (EIA).
Three Countries Account for 40% of Global Oil Production
In 2023, the United States, Russia, and Saudi Arabia collectively contributed 32.7 million barrels per day to global oil production.
| Oil Production 2023 | Million barrels per day |
|---|---|
| 🇺🇸 U.S. | 12.9 |
| 🇷🇺 Russia | 10.1 |
| 🇸🇦 Saudi Arabia | 9.7 |
| 🇨🇦 Canada | 4.6 |
| 🇮🇶 Iraq | 4.3 |
| 🇨🇳 China | 4.2 |
| 🇮🇷 Iran | 3.6 |
| 🇧🇷 Brazil | 3.4 |
| 🇦🇪 UAE | 3.4 |
| 🇰🇼 Kuwait | 2.7 |
| 🌍 Other | 22.8 |
These three nations have consistently dominated oil production since 1971. The leading position, however, has alternated among them over the past five decades.
In contrast, the combined production of the next three largest producers—Canada, Iraq, and China—reached 13.1 million barrels per day in 2023, just surpassing the production of the United States alone.
In the near term, no country is likely to surpass the record production achieved by the U.S. in 2023, as no other producer has ever reached a daily capacity of 13.0 million barrels. Recently, Saudi Arabia’s state-owned Saudi Aramco scrapped plans to increase production capacity to 13.0 million barrels per day by 2027.
In 2024, analysts forecast that the U.S. will maintain its position as the top oil producer. In fact, according to Macquarie Group, U.S. oil production is expected to achieve a record pace of about 14 million barrels per day by the end of the year.
Energy Shift
How Much Does the U.S. Depend on Russian Uranium?
Despite a new uranium ban being discussed in Congress, the U.S. is still heavily dependent on Russian uranium.

How Much Does the U.S. Depend on Russian Uranium?
This was originally posted on our Voronoi app. Download the app for free on iOS or Android and discover incredible data-driven charts from a variety of trusted sources.
The U.S. House of Representatives recently passed a ban on imports of Russian uranium. The bill must pass the Senate before becoming law.
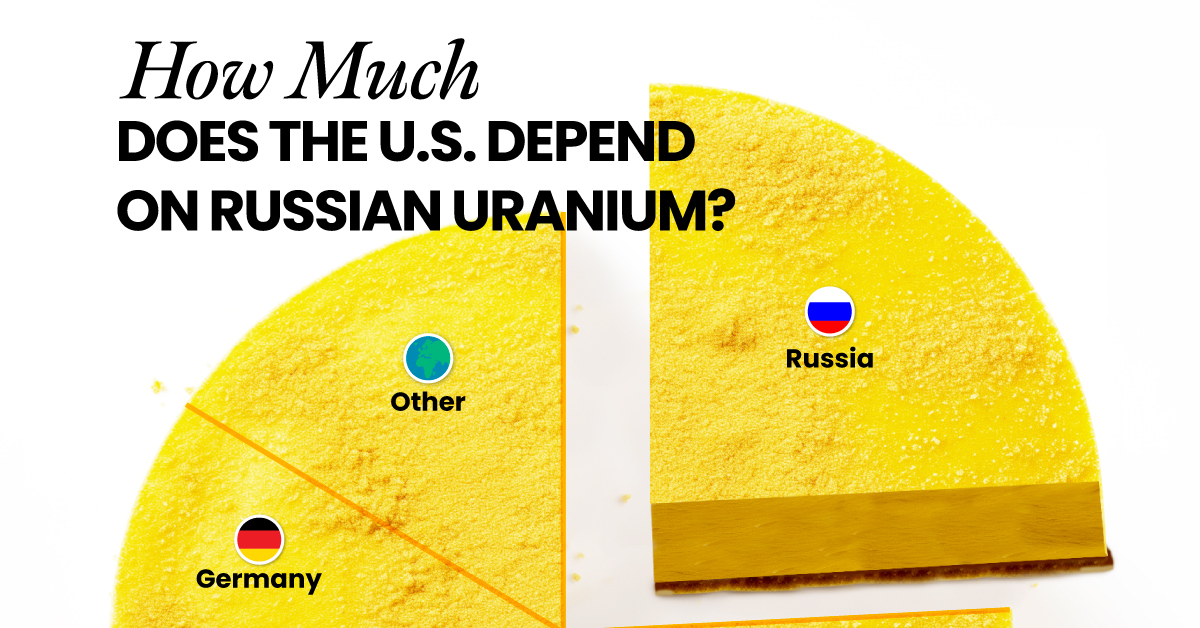
In this graphic, we visualize how much the U.S. relies on Russian uranium, based on data from the United States Energy Information Administration (EIA).
U.S. Suppliers of Enriched Uranium
After Russia invaded Ukraine, the U.S. imposed sanctions on Russian-produced oil and gas—yet Russian-enriched uranium is still being imported.
Currently, Russia is the largest foreign supplier of nuclear power fuel to the United States. In 2022, Russia supplied almost a quarter of the enriched uranium used to fuel America’s fleet of more than 90 commercial reactors.
| Country of enrichment service | SWU* | % |
|---|---|---|
| 🇺🇸 United States | 3,876 | 27.34% |
| 🇷🇺 Russia | 3,409 | 24.04% |
| 🇩🇪 Germany | 1,763 | 12.40% |
| 🇬🇧 United Kingdom | 1,593 | 11.23% |
| 🇳🇱 Netherlands | 1,303 | 9.20% |
| Other | 2,232 | 15.79% |
| Total | 14,176 | 100% |
SWU stands for “Separative Work Unit” in the uranium industry. It is a measure of the amount of work required to separate isotopes of uranium during the enrichment process. Source: U.S. Energy Information Administration
Most of the remaining uranium is imported from European countries, while another portion is produced by a British-Dutch-German consortium operating in the United States called Urenco.
Similarly, nearly a dozen countries around the world depend on Russia for more than half of their enriched uranium—and many of them are NATO-allied members and allies of Ukraine.
In 2023 alone, the U.S. nuclear industry paid over $800 million to Russia’s state-owned nuclear energy corporation, Rosatom, and its fuel subsidiaries.
It is important to note that 19% of electricity in the U.S. is powered by nuclear plants.
The dependency on Russian fuels dates back to the 1990s when the United States turned away from its own enrichment capabilities in favor of using down-blended stocks of Soviet-era weapons-grade uranium.
As part of the new uranium-ban bill, the Biden administration plans to allocate $2.2 billion for the expansion of uranium enrichment facilities in the United States.
-

 Electrification3 years ago
Ranked: The Top 10 EV Battery Manufacturers
-

 Electrification2 years ago
The Key Minerals in an EV Battery
-

 Real Assets2 years ago
The World’s Top 10 Gold Mining Companies
-

 Misc3 years ago
All the Metals We Mined in One Visualization
-

 Electrification3 years ago
The Biggest Mining Companies in the World in 2021
-

 Energy Shift2 years ago
What Are the Five Major Types of Renewable Energy?
-

 Electrification2 years ago
The World’s Largest Nickel Mining Companies
-

 Electrification2 years ago
Mapped: Solar Power by Country in 2021


